Inputs
ELLA mainly takes two pandas data frames as inputs.
1. Gene expression with nuclear center
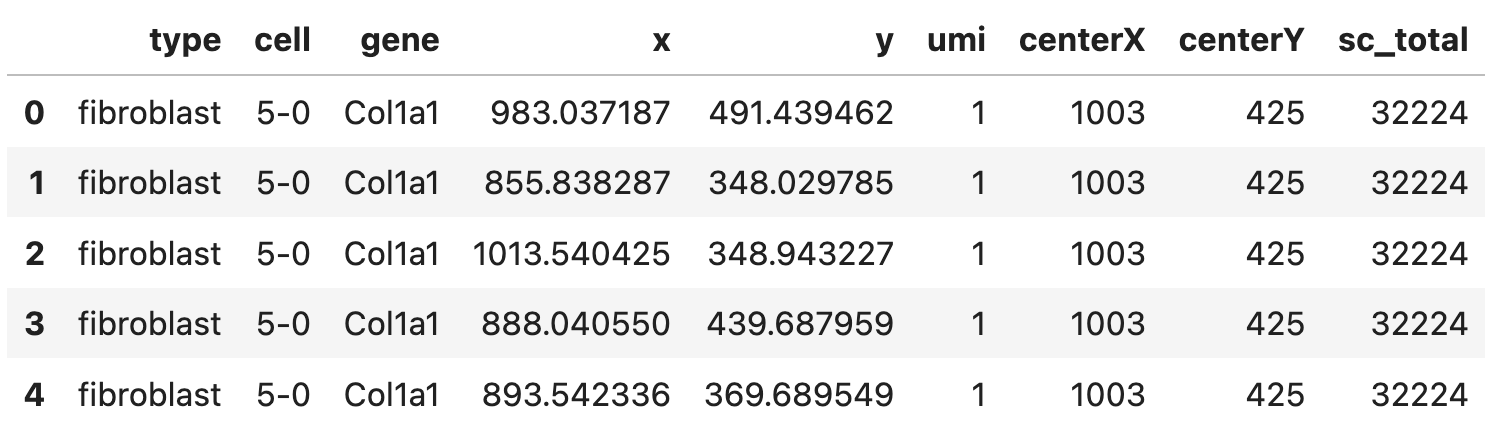
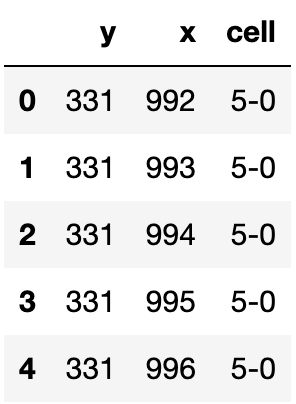
A pandas data frame (expr) with a few columns:
- spatial gene expression including the coordinates (
x,y) and the corresponding counts (umi) - cell center (
centerX,centerY) - cell type (
type), cell ID (cell), gene ID (gene) - and the total number expression counts of cells (
sc_total), rows corresponding to the same cell should have the same value for this column.
Here’s how the data frame looks like:
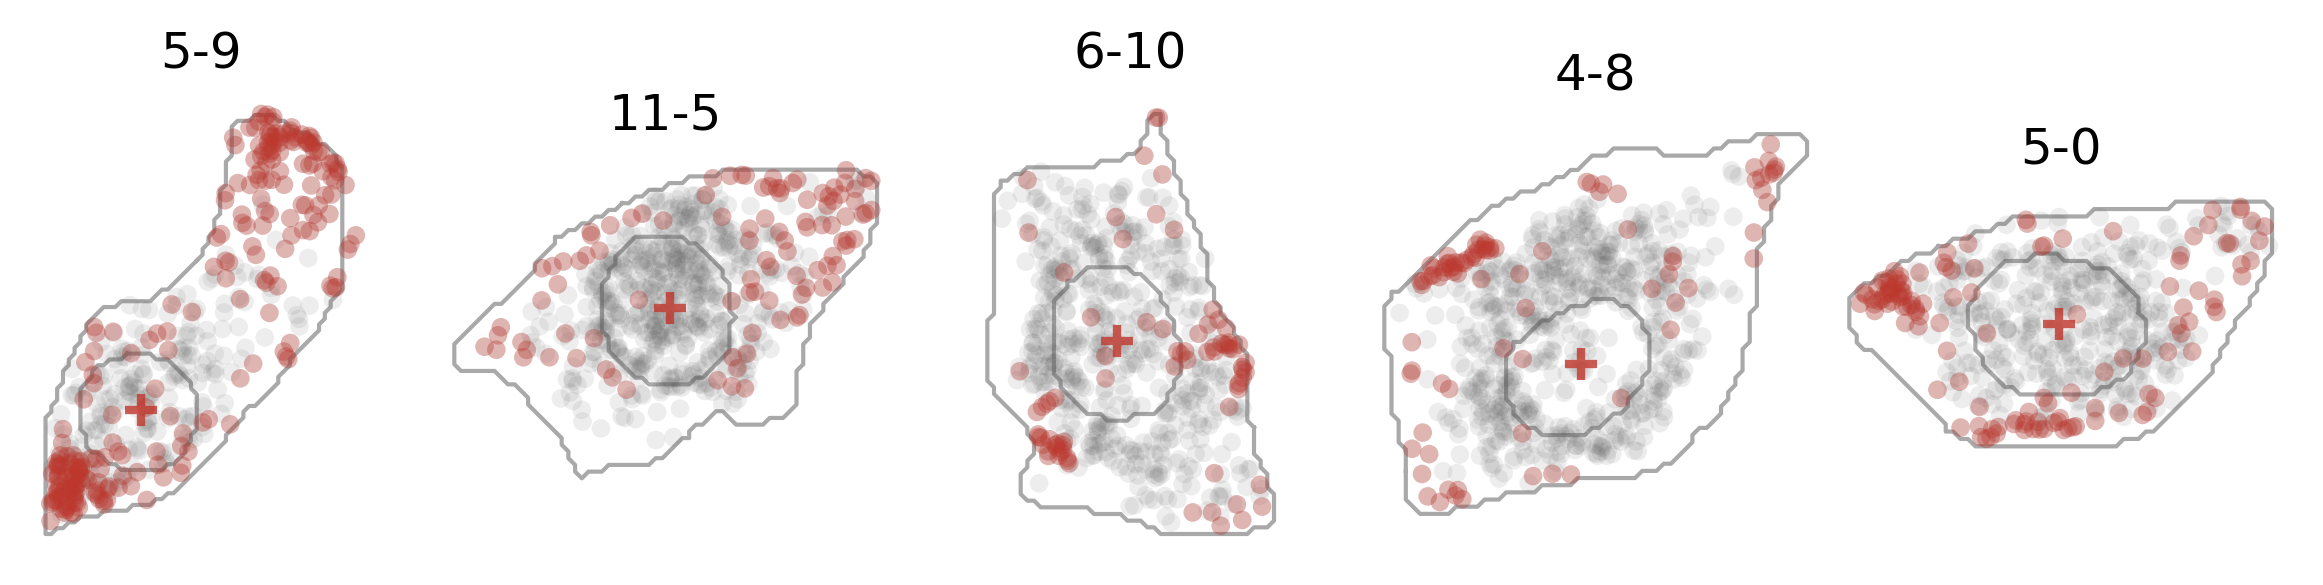
And here’s how the expression of one gene (dots in red) and the cell center (crosses in red) looks like:
2. Cell segmentation
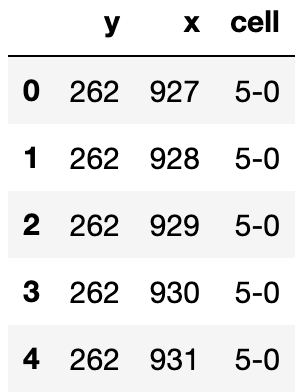
A pands data frame (cell_seg) with 3 columns:
- cell ID (
cell) - the coordinates of points that characterize the cell segmentation boundary (
cell_seg).
Here’s how the data frame looks like:
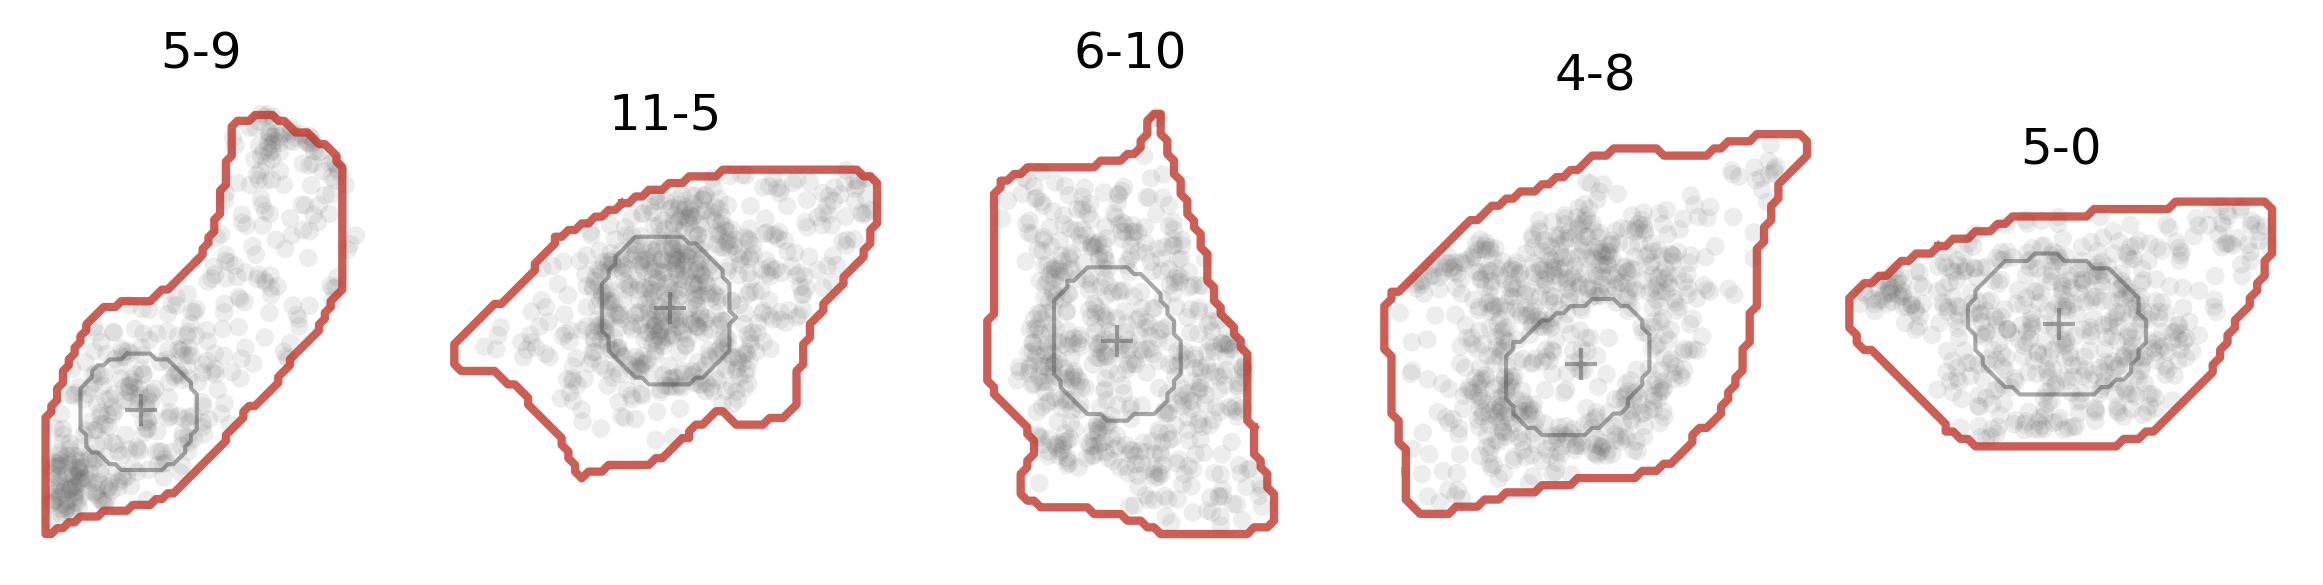
And here’s how it actually looks like (in red solid line):
Nucleus segmentation
[Optional, for visualization purpose ONLY]
A pands dataframe (nucleus_seg) with 3 columns:
- cell ID (
cell) - the coordinates of points that characterize the nucleus segmentation boundary (
nucleus_seg).
Here’s how the data frame looks like:
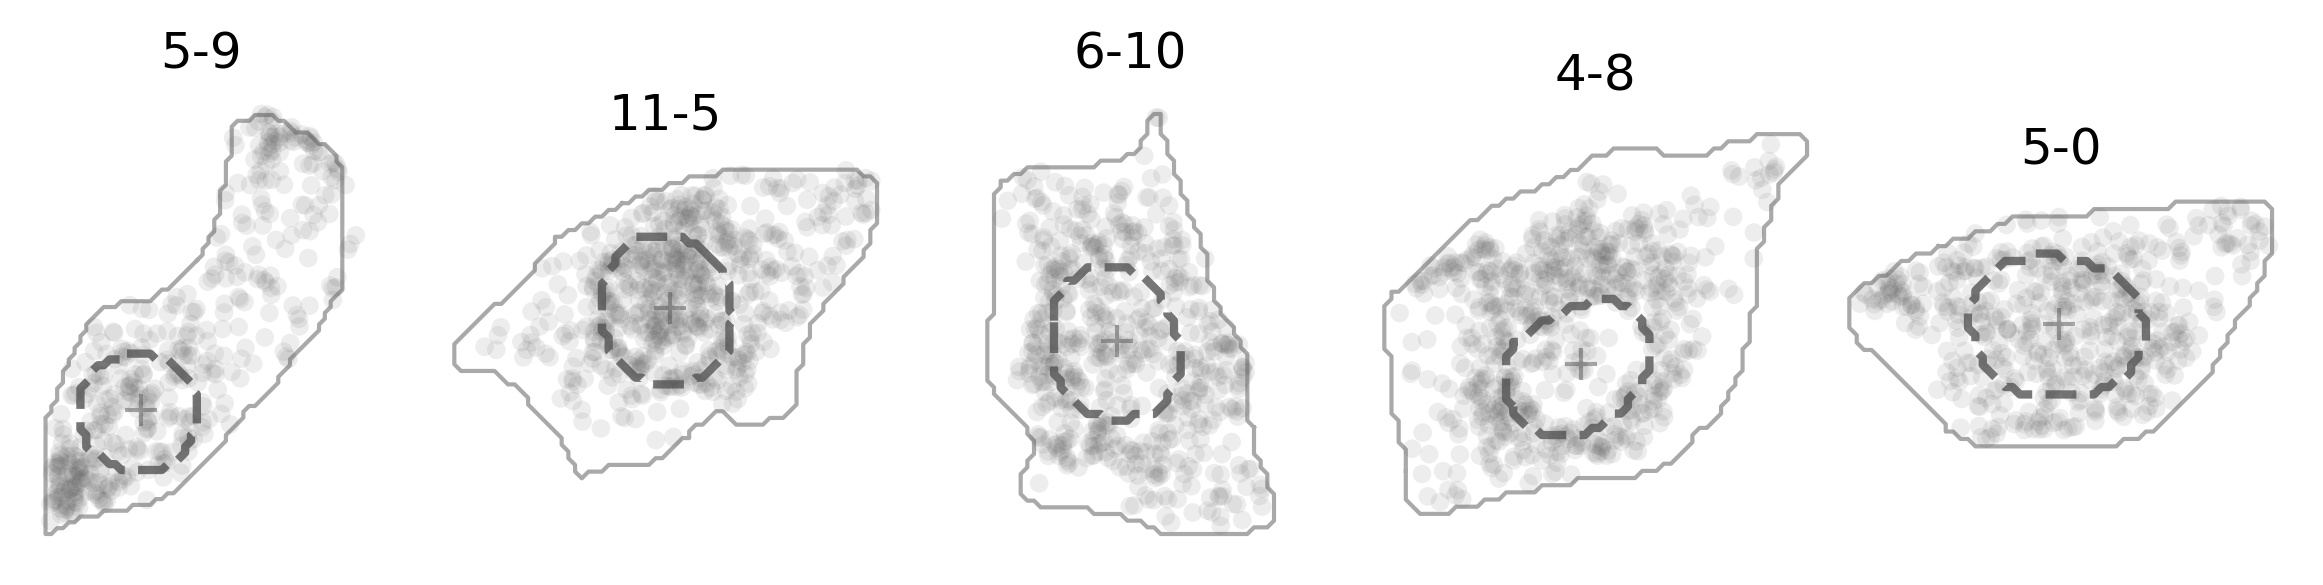
And here’s how it actually looks like (in darkgray dashed line):
Other required inputs
typesa list corresponding to all cell types.cellsa dictionary of lists corresponding to list of cells in each cell type.cells_alla list of all cells across cell types.genesa dictionary of lists corresponding to list of genes in each cell type.
How about tweak your own data into the format that ELLA takes and have a try!